Calibrating brushless motor
In my last week's work, I discovered that the motor's movement is not continueous or consistent with the input of a sine wave, as a result of the triple half bridge performace. So I decided to recalibrate the drive function to map the real angle of the motor to output signals that can generate that angle. To do that, I need a rotary encoder, which can measure the angle at each output configuration. Because I had the accelarometer working during the input device week and can be conveniently used to measure the angle, I can save the money to purchase a encoder.
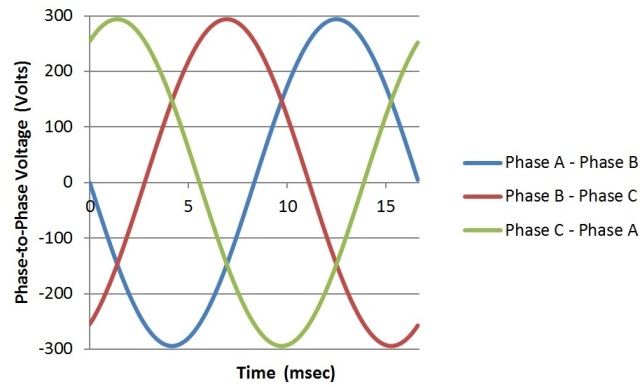
The scheme works as following: I used the sine wave (shown above) to drive the motor very slowly (~0.1deg/s) and fix the accelerometer on the rotator of the motor and read out the acceleration on x and y axis. Then the angle of the motor can be easily determined by tan(\theta) = AcX/AcY. I wrote some python code to read the data through serial and saved them in to file as well as plotting it in real time. The code is following:
	import serial
	import numpy
	import matplotlib.pyplot as plt
	from drawnow import drawnow

	def updateplot(): // plot function
	    plt.title('Calibration')
	    plt.ylabel('AcX')
	    plt.plot(x,y2)
	    plt.plot(x,y3)

	ser = serial.Serial('COM6',9600)
	ser.setDTR()
	ser.flushInput()
	count = 0
	x = []
	y1 = []
	y2 = []
	y3 = []

	plt.ion() //use interactive mode

	for i in range(8000):
	    x.append(count)
	    data = str(ser.readline(),'utf-8') // read from serial
	    data=data.strip('\n') //get rid of return
	    data1,data2,data3 = data.split(',')  // split different data field
	    y1=numpy.append(y1,int(data1)) // create arrays
	    y2=numpy.append(y2,int(data2))
	    y3=numpy.append(y3,int(data3))
	    count += 1
	    drawnow(updateplot) //update figure
	ser.close()
	numpy.savetxt('cali_v2', (y1,y2,y3)) // save data
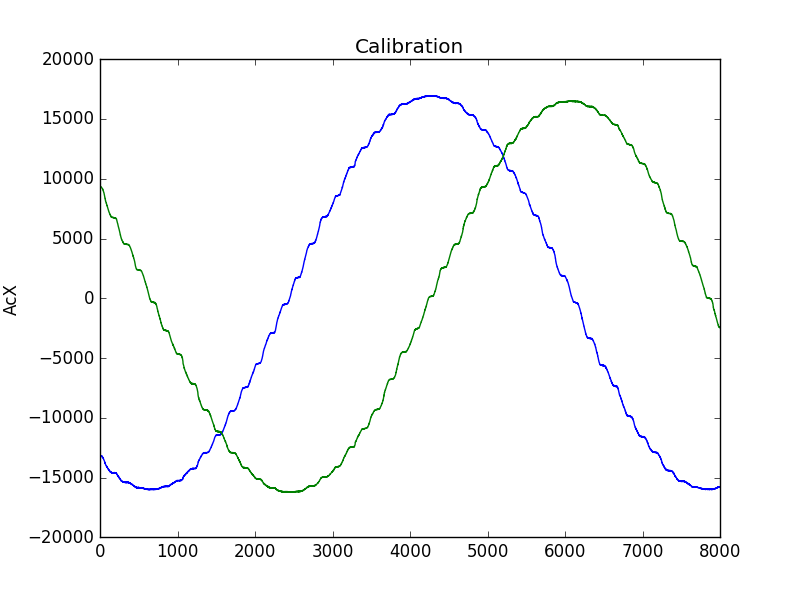
The measured AcX and AcY is shown below.
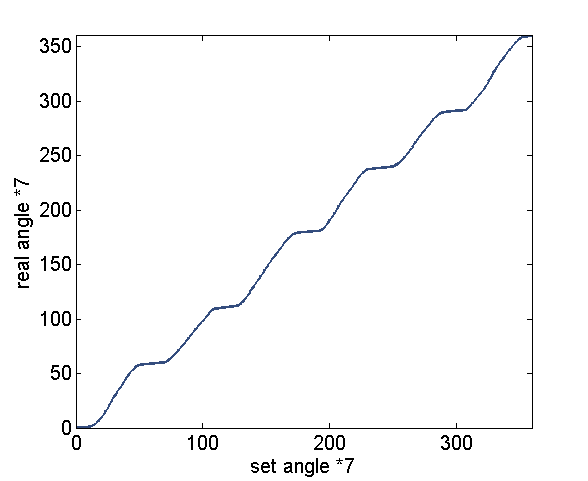
After processing the data into angle and averaging between different sub-rotations in matlab, I get the following calibration curve. From this curve the stalling behaviour is evident.
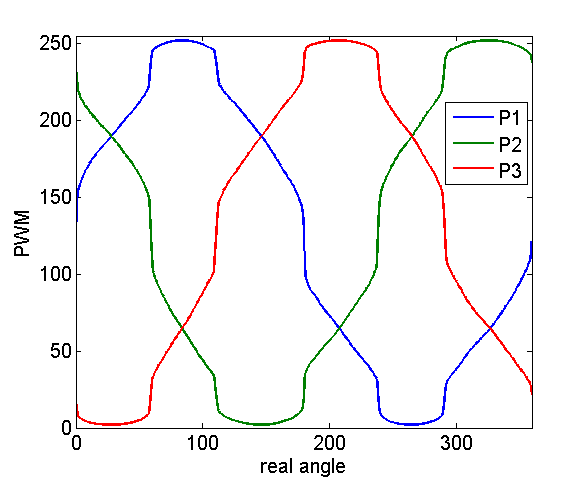
By interplot the output waveform with this calibration curve, I thus get the calibrated output PWM waveform as following.